Can you create a pie chart with varying slice sizes in d3?

1.6k Views Asked by At

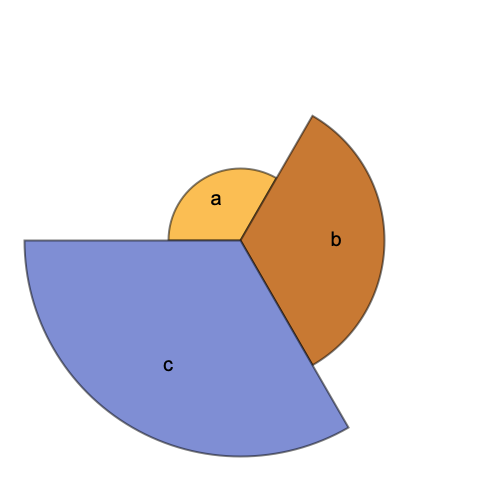
I'm trying to make something like Wolfram's SectorChart in d3 (https://reference.wolfram.com/language/ref/Files/SectorChart.en/O_5.png). I'm currently using a basic data set of

[ { label:0, radius:1 }, { label:1, radius:1 }, { label:2, radius:2 }];

and I'm trying to vary the outer radius of the arc with the following function

var arc = d3.arc()
      .innerRadius(0)
      .outerRadius(function(d) { return d.radius * 100; })

But this is not functional. Is it even possible to do this in d3? If so, am I on the right path? Thanks

2

There are 2 best solutions below

1
On BEST ANSWER

Yeah, you can

what you are missing is, that you can't access directly d.radius because pie layout is applied to the data, which wraps old data to the data property, so your code should be like this

var arc = d3.arc()
      .innerRadius(0)
      .outerRadius(function(d) { return d.data.radius * 100; })

fiddle

var arc = d3.svg.arc()
  .innerRadius(0)
  .outerRadius(function (d,i) { 
      return d.data.radius*100
  });
  
  
  var pie = d3.layout.pie()
    .sort(null)
    .value(function(d) { return d.radius; });
    
 var svg =  d3.select('#result').append('svg').attr('width',500).attr('height',500)
 
 svg.selectAll('path')
    .data(pie([{ label:0, radius:1 }, { label:1, radius:1 }, { label:2, radius:2 }]))
    .enter()
    .append('path')
    .attr('d',arc)
    .attr('transform','translate(250,250)')
    .attr('fill','yellow')
    .attr('stroke','black')
<script src="https://cdnjs.cloudflare.com/ajax/libs/d3/3.4.11/d3.min.js"></script>
<div id='result'>

</div>

0
On

Will this Aster Plot work for you?