I want to create some code in TabPy that will count the frequency of words in a column and remove stop words for a word cloud in Tableau.
I'm able to do this easily enough in Python:
other1_count = other1.answer.str.split(expand=True).stack().value_counts()
other1_count = other1_count.to_frame().reset_index()
other1_count.columns = ['Word', 'Count']

### Remove stopwords
other1_count['Word'] = other1_count['Word'].apply(lambda x: ' '.join([word for word in x.split() if word not in (stop)]))
other1_count['Word'].replace('', np.nan, inplace=True)
other1_count.dropna(subset=['Word'], inplace=True)
other1_count = other1_count[~other1_count.Word.str.contains("nan")]
But less sure how to run this through TabPy. Anyone familiar with TabPy and how I can make this run?
Thanks in advance.

I worked on a project that accomplished something very similar a while back in R. Here's a video example showing the proof-of-concept (no audio). https://www.screencast.com/t/xa0yemiDPl
It essentially shows the end state of using Tableau to interactively examine the description of wines in a word-cloud for the selected countries. The key components were:
High-Level Overview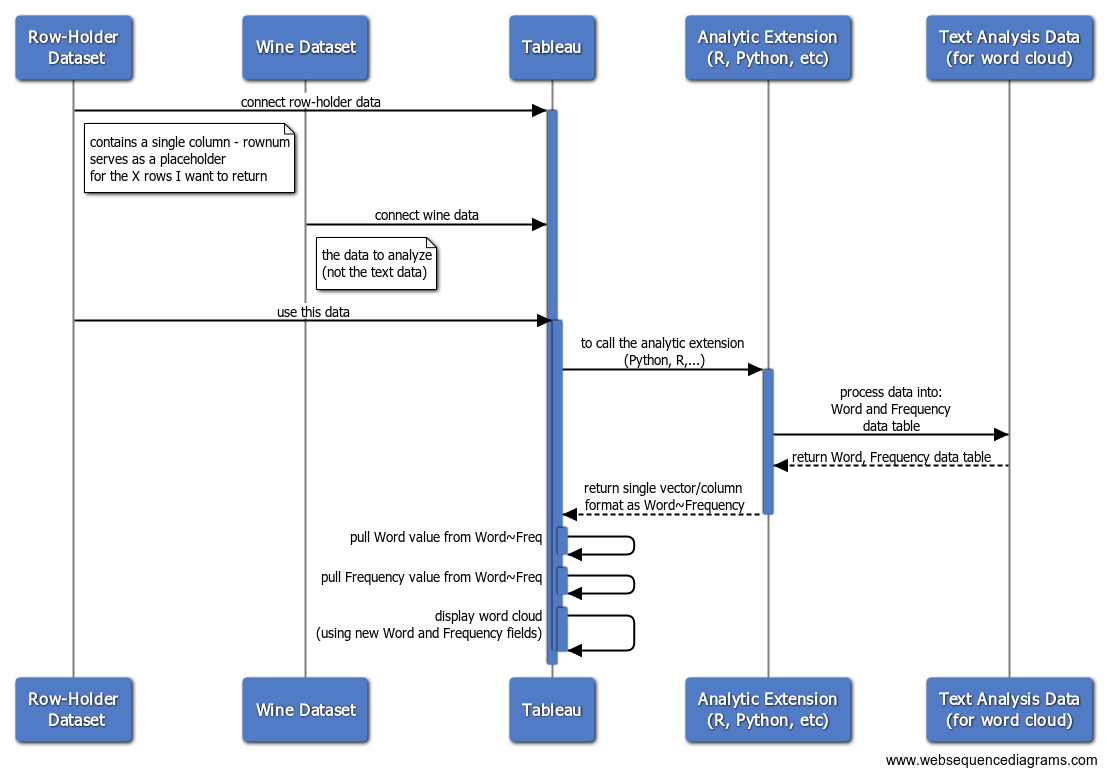
Tableau Calculated Field - [R Words+Freq]:
Tableau Calculated Field for the Word Value:
Tableau Calculated Field for the Frequency Value:
If you're not familiar with Tableau, you'll likely want to work alongside a Tableau analyst at your company that is. They'll be able to help you create the calculated fields and configure Tableau to connect to TabPy.