I'm trying to plot a heatmap like:
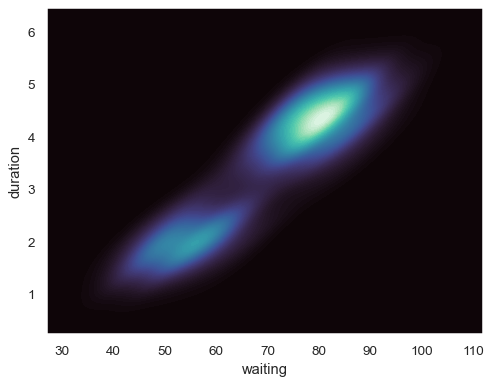
(https://seaborn.pydata.org/generated/seaborn.kdeplot.html - last plot on the page)
But when I try this with my code I get:

My Pandas dataframe exists of two cols (x and y - both int64) and a number of rows. :

My code:
sns.kdeplot(data=dataFrame, fill=True, thresh=0, levels=100, cmap="mako", cbar=True)
My question is now how do I get rid of the contours, fill the background an make a smooth colorbar on the side?