I have a program that calls libc::memchr many times. When profiling my code I see that
the function using the most time is DlsymWeak::initialize. initialize seem to be called by memchr, which is called by my wrapper:
pub fn memchr_libc_ptr(ptr: *const std::os::raw::c_void, len: usize, needle: u8) -> Option<usize> {
    let res = unsafe { // Profiler calls out this function call as slow
        libc::memchr(
            ptr,
            needle as i32,
            len)
    };
    if res == 0 as *mut std::os::raw::c_void {
        return None;
    }
    let res = res as *const u8;
    let ptr = ptr as *const u8;
    Some((unsafe { res.offset_from(ptr) }) as usize)
}
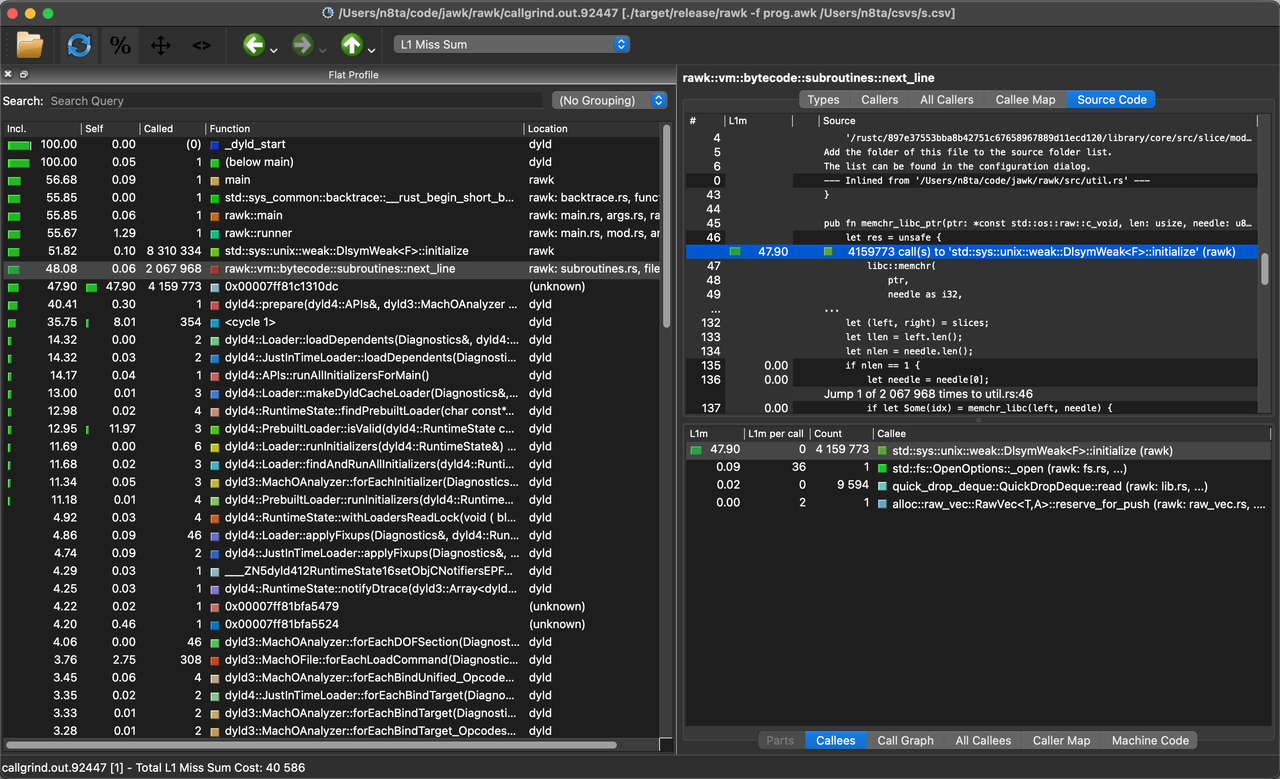
Further more the initialize source code says that this method should be cold "should only happen during first-time initialization" but clearly it's being called much more than that.
What is DlsymWeak::initialize? Can I avoid all these calls to it?
This is running on MacOS 12.3.1 rustup 1.25.1 (bb60b1e89 2022-07-12), x86-64 with the following profile
[profile.release]
lto = true
codegen-units = 1
debug = true
panic = "abort"
overflow-checks = false
incremental = false