I'm trying to create a plot using Kotlin and androidplot library. My source code is:
val domainLabels = arrayOf<Number>(1,2,3,6,7,8,9,10,13,14)
val series1Number = arrayOf<Number>(1,4,8,12,16,32,26,29,10,13)

val series1 : XYSeries = SimpleXYSeries(Arrays.asList(* series1Number)),SimpleXYSeries.ArrayFormat.Y_VALS_ONLY,"Series 1")
val series1Format = LineAndPointFormatter(Color.BLUE,Color.BLACK,null,null)
binding.plot.addSeries(series1,series1Format)
binding.plot.graph.getLineLabelStyle(XYGraphWidget.Edge.BOTTOM).format = object : Format(){
        override fun format(p0: Any?, p1: StringBuffer, p2: FieldPosition?): StringBuffer {
            val i = Math.round((p0 as Number).toFloat())
            return p1.append(domainLabels[i])
        }

        override fun parseObject(p0: String?, p1: ParsePosition?): Any? {
            return null
        }

    }
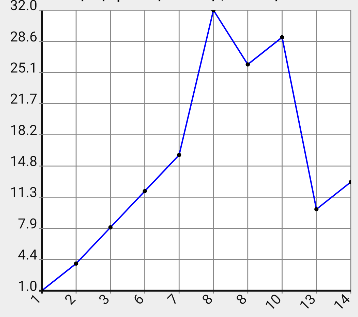
Although it works, I have some troubles when the domainLabel is the same. Look at the image below for x value equals 8. I expect that since the x value is the same, it will be shown only one time, and I will have two points. Do you have any suggestions?

This looks suspiciously like a precision error, and this would appear to be the likely culprit:
I'm not positive but I suspect the above Kotlin code is not functionally identical to:
Which I did just confirm works as expected. Best suggestion would be to check this out in the debugger and see if your 9's are getting truncated to 8's.